

Be aware: Google has introduced a new campaign type that will replace Smart Shopping: Performance Max Campaign (PMC). All Smart Shopping Campaigns will automatically be migrated to PMCs, starting July 2022.
Read more about Performance Max here, or download our whitepaper for more in-depth information.
What is a POAS target?
Before I go deeper into the buckets method, I will first discuss the POAS (“profit method”), which you may already be familiar with. POAS also stands for Profit On Ad Spend.
With a POAS target, you look at the profitability of your ads, in contrast to a ROAS objective, where you look at the sometimes “misleading” revenue from ads. I call this misleading because you can perform quite well on the basis of turnover, but you can ultimately suffer a loss.
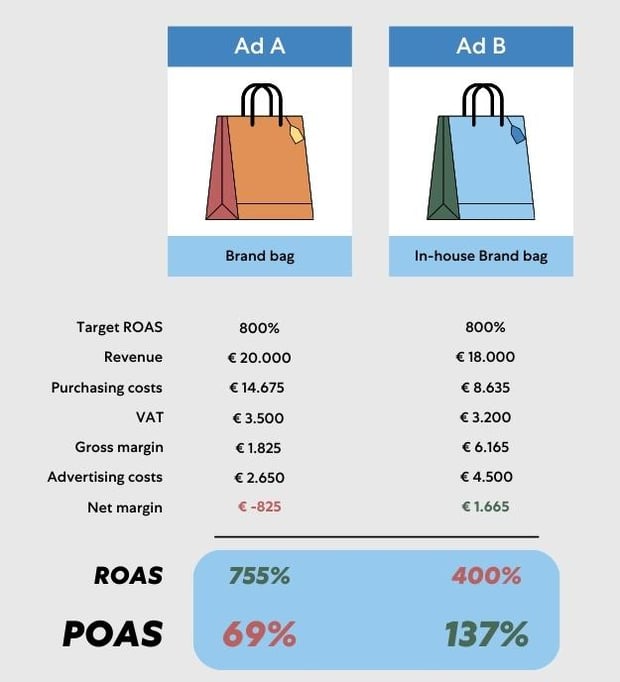
Take a look at the calculation example below. The gross margin of both handbags is the turnover excluding VAT, minus purchase costs, shipping costs and payment costs. However, advertising costs have not yet been included.
If you then subtract the advertising costs from the gross margin, you arrive at a net margin, which on the left comes to -825 euros and on the right to +1665 euros.
ROAS versus POAS
If you look at the ROAS and POAS results in the calculation example above, you might have stopped ad B based on ROAS. That would be a good choice if you are looking at sales, but if you look at the profitability of the ads, you see that ad B (POAS> 100%) wins over ad A.
POAS <100%, in the case of ad A, means that your gross margin is less than your Ads’ costs and that you are therefore at a loss. POAS> 100%, on the other hand, means that you are making a profit.
Note: the term gross margin is interpreted in different ways by marketers; sometimes, for example, as a metric where the shipping costs are not yet taken off. Do you want to understand this method properly? Then it is important that you interpret the terms in the way that I use them in this article.
Tip: Download the guide: From ROAS to POAS and learn how to implement Profit On Ad Spend step-by-step in your campaigns.
Profit buckets
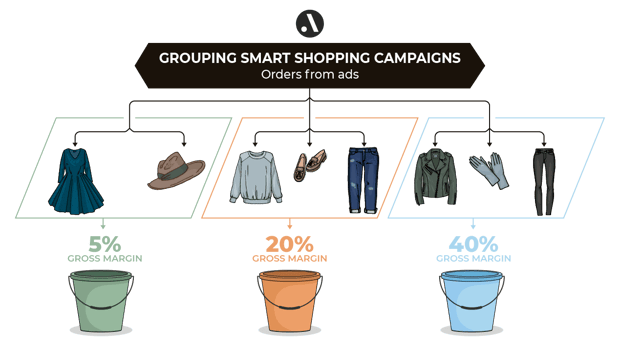
Now that you understand POAS, I can move on to buckets. For that I will first go to Google’s advice: Google recommends creating Performance Max campaigns based on margin%.
After all, for products with a low margin%, you want to offer less (or: set a higher ROAS target) than for products with a high margin%.
Performance Max campaigns, classified on the basis of products with an equal order margin%, are translated as buckets. These are flexible (profit) buckets in which you place products with the same gross order margin%, or gross order margin / turnover of order (both excluding VAT).
If we go back to the example with the handbags and apply the above calculation to it, the ad with handbag B would end up in a bucket where the following gross margin% of 42% fits, because:
6165 / (18000 – 3200) * 100% = 42%
You prefer not to have a separate bucket for each gross margin%, so it is advisable to make a division into ranges. You can have 8 buckets, but also 3. It is important that the layout fits your business.
Each profit bucket (i.e., Performance Max campaign) then receives its own ROAS target, which is based on the gross margin%.
Note: This concerns orders from advertisement with equal margin%
Note, the most important thing is that you base this gross margin% on the orders resulting from the advertisement of the product. The product you sell is not always the product you advertise on. You can find out more about that in this blog entry on cross and upsell insights.
If we are going to portray the above story, it looks like this:
Buckets for Search Campaigns
Good to know: Buckets can also be used for Search Campaigns, but not per product, but per keyword.
Instead of classifying products based on gross margin%, you can also determine the gross margin% for each keyword and thus create the bucket classification. A ROAS target is then set for each bucket.
In practice, you often take the gross margin% of the campaign or multiple campaigns together, instead of the gross margin% of a keyword. This is preferred because with Search, it is less easy to move keywords to another bucket. You advertise not only on products, but also on brands, product types, etc. (You could also adjust your campaign structure to your gross margin%, but you will prefer not to do this too often, because this takes a lot of time.)
How do you use ROAS correctly?
The ROAS objective is often a “given” that is adjusted by a marketer with the aim of, for example, generating more sales or reducing costs. However, this can be used in a much better way.
Ideally, a bucket with a high gross margin% will have a lower ROAS target than a bucket with a low gross margin%.
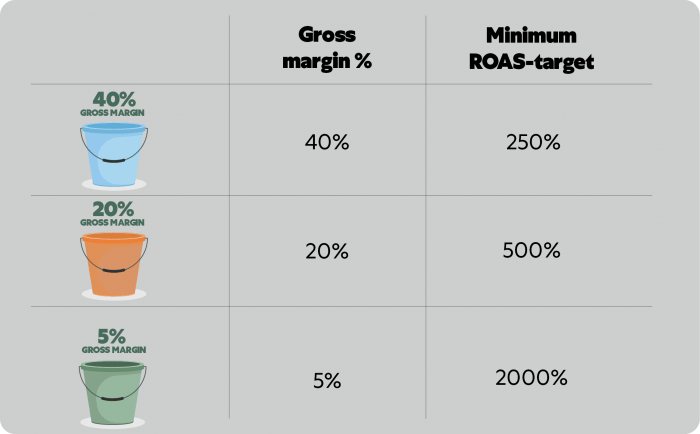
As you may know, a ROAS target is actually always indirectly based on the gross margin%.
For example, if a bucket has a gross margin% of 20%, then you want to be able to pay your Ads costs from that 20% margin and probably still have some left over. So for every euro you spend in Ads, you want at least 5 back.
If you look at the image above, in the case of a 20% margin, it corresponds to a ROAS target of at least 500%, because 1 / 0.20 * 100% = 500%. This way you can also calculate that for the green and blue bucket.
How does the Google bid simulator work?
I’m now going to make the switch to Google’s bid simulator. The Google bid simulator can provide insight into how different objectives can influence your traffic for different ROAS objectives of one Performance Max Campaign (bucket).
For example, the bid simulator looks like this for the blue bucket:
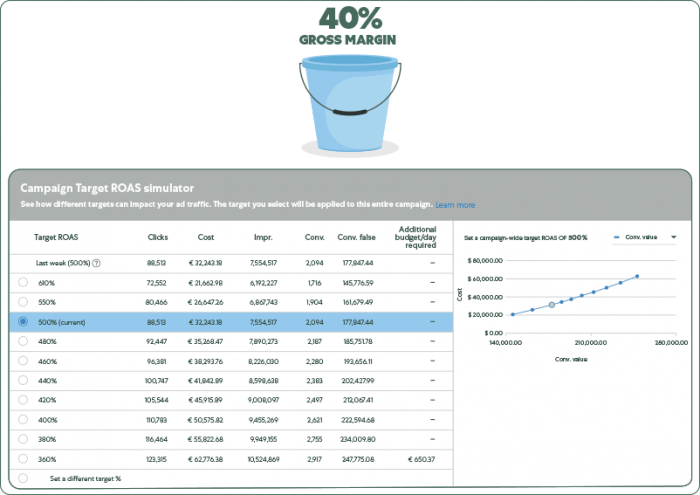
The Google Ads bid simulator shows how changes to ROAS targets can affect campaign performance.
In this example, you can see that the current ROAS target is 500%. By lowering the target to, say, 460%, Google expects you to get around 8,000 additional clicks for just over $6,000 in costs and nearly 200 additional conversions.
Improve Google bid simulator in 2 steps
As you saw in the image above, the Google bid simulator is about conversion value, but not about profit. You want to set the ROAS objective in such a way that the net margin / profit (or gross margin minus ads costs) is the maximum you can achieve.
To do this, you must first take two steps:
1) Improve conversion value
Google wants to simplify its service and keep it simple to be able to serve as many parties as possible with automation. It is good to know that the conversion value in Ads depends on your implementation.
For example, the conversion value including or excluding VAT can be used here, but the shipping fee (what the customer pays) can also be included by Google or not.
My advice is to at least optimize this conversion value, which you do by setting the conversion value ex. VAT as a starting point and also by processing cancellations and returns. These are almost never corrected in Ads.
Also, the conversion value in the bid simulator does not consider the conversion rate change when lowering or increasing the goals.
The conversion rate will be lower when the ROAS target is lowered because you will be shown more with generic, and often less converting, search terms and vice versa.
For these reasons, I recommend calculating the conversion value yourself, by determining and combining the following factors separately:
- The conversion rate;
- The average conversion value per conversion;
- The number of clicks from the bid simulator.
2) Add POAS margin information
By subsequently adding POAS data to the bucket and combining this with the improved conversion value, you can predict what the net margin will be for the various ROAS objectives.
POAS data is about gross margin data: including purchase costs, shipping costs, etc.
The net margin is the gross margin minus the Ads costs: decreasing the ROAS target will increase the Ads costs and increasing the ROAS target will decrease the Ads costs. You would therefore prefer to increase your net margin.
25,000 more turnover due to 2000 less margin
In the example below, you can see the blue bucket with 40% margin again, but in combination with the Google bid simulator, improved in the above way. Pay attention to the 10 colored boxes, which I will explain below:
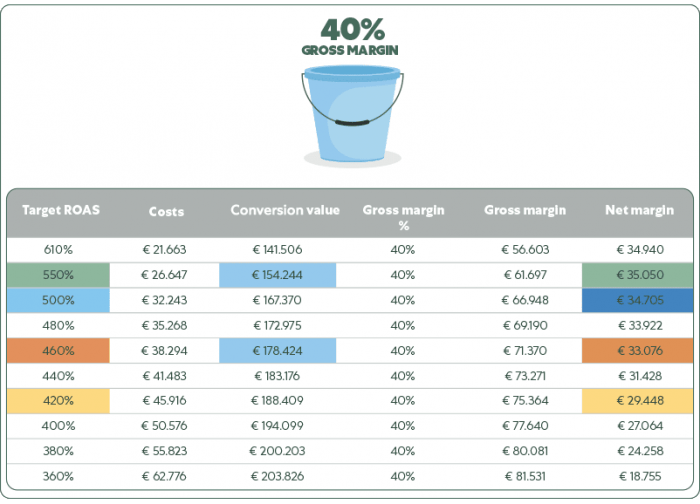
In the example above, 500% is the starting situation of this marketer (see dark blue boxes).
As you can see, the net margin has reached the optimum with a ROAS target of 550% (see green boxes). You can set this optimum, but you can also choose to settle for less margin but more turnover, for example, with a target of 420% (see yellow boxes).
At EUR 2000 less margin (EUR 33076: orange box) than the margin at the optimum (EUR 35050: green box), the conversion value will increase by almost EUR 25,000 (see two light blue boxes).
What a top insight, isn’t it? You could never have known this without adding this data. I don’t know whether that would also be the best outcome for you. What is best is different for every organization, depending on your KPIs.
Please note: these figures are less reliable when lowering / increasing the ROAS target in large steps. Google, as you know, is not very good at dealing with extreme changes (it is then more difficult to achieve objectives), so ideally you better move towards the optimum in small steps.
How can you apply the above principle yourself?
A very basic version of the above principle is not difficult to implement. It can be achieved by, for example, creating buckets based on product margins, followed by finding the optimal ROAS target using the bid simulator.
Please note that this can deviate strongly from reality. In such a basic version, you assume that the product that is advertised will also be bought. But in many cases, the order contains products other than the one advertised, as I explained above. As a result, the gross margin% of the order will probably be different from the gross margin% of the product.
It is also not easy to include cancellations and return dates in such a basic version and the gross margin% is less reliable. With a small difference in gross margin%, the optimum of the net margin can be completely different. It is therefore advisable to include the order data (preferably including returns, etc.) in determining the optimal ROAS target.
To make the above clear, you need at least knowledge of different data sources and how to link them together. Data science certainly comes into play here.
Conclusion: Use automation in the ultimate way
I will summarise everything briefly and succinctly:
By including ROAS and POAS objectives, you can steer on net margin, turnover or both. Depending on what fits the KPIs of your organization.
PPC management software automatically adds improved insights to Google’s bid simulator through the use of data science.
Does this all sound like a far-off show? In any case, start with step 1 from this article: making your POAS transparent. A small step in the right direction, but already extremely valuable in automation.
Tip: Download the guide: From ROAS to POAS and learn how to implement Profit On Ad Spend step-by-step in your campaigns.